

Points, Regions, Distance and Midpoints
In this section, we’ll review plotting points in the
coordinate plane, then graph vertical lines,
horizontal lines and some inequalities. We’ll also review the Pythagorean
Theorem, develop a
formula for finding the distance between two points in the coordinate plane and
one for finding
the midpoint of a line segment with given endpoints.
Graphing Points
Here’s the coordinate plane:
It consists of two number lines that are perpendicular to
one another. The horizontal number line
is called the x axis and the vertical number line is called the y axis. The
point where the two
number lines intersect is called the origin. The number lines divide the plane
into four regions,
called quadrants.
The pair, (x, y), is called an ordered pair. It
corresponds to a single unique point in the
coordinate plane. The first number is called the x coordinate, and the second
number is called the
y coordinate. The ordered pair (0, 0) names to the origin. The x coordinate
tells us the horizontal
distance a point is from the origin. The y coordinate tells us the vertical
distance a point is from
the origin. You’ll move right or up for positive coordinates and left or down
for negative
coordinates.
So, the point (3, 6) is three units to the right of the origin, and then 6 units
up.
The point (-2, -8) is two units to the left of the origin, and then 8 units
down.
The point (5, -4) is five units to the right of the origin, and then 4 units
down.
Example 1: State the ordered pairs associated with each point labeled on the
graph:
Example 2: Plot the following points in the coordinate
plane:
A (-3, 5)
B (-6, 0)
C (7, 1)
D (0, 8)
E (-5, -3)
F (8, -2)
Graphing Regions in the Coordinate Plane
The set of all points in the coordinate plane with y coordinate k is the
horizontal line y = k.
The set of all points in the coordinate plane with x coordinate k is the
vertical line x = k.
Example 3: Graph y = 3 in the coordinate plane.
Example 4: Graph x = -7 in the coordinate plane.
The region y < k is the part of the coordinate plane below
the line y = k , not including the line
itself. The region y ≤ k is the part of the coordinate plane below the line y =
k , including the
line itself.
The region y > k is the part of the coordinate plane above the line y = k , not
including the line
itself. The region y ≥ k is the part of the coordinate plane above the line y =
k , including the
line itself.
The region x < k is the part of the coordinate plane to the left of the line x =
k , not including the
line itself. The region x ≤ k is the part of the coordinate plane to the left of
the line x = k ,
including the line itself.
The region x > k is the part of the coordinate plane to the right of the line x
= k , not including
the line itself. The region x ≥ k is the part of the coordinate plane to the
right of the line x = k ,
including the line itself.
For y > k or y < k , the line y = k is drawn as a dotted line. For x < k or x >
k , the line x = k is
drawn as a dotted line. For y ≤ k or y ≥ k , the line y = k is drawn as a solid
line. For x ≤ k or
x ≥ k , the line x = k is drawn as a solid line.
In the exercises, you will see these written using set notation, e.g., {(x, y)l
y ≤ k}.
Example 4: Graph in the coordinate plane: y ≥ -2 .

Example 5: Graph in the coordinate plane: x < 3 .

Example 6: Graph in the coordinate plane: - 2 < x ≤ 5
Example 7: Graph {(x, y) l3 ≤ y ≤ 8 }.
Example 8: Graph {(x, y) lx < 4 and y ≥ -1 }.
The Pythagorean Theorem
In a previous course, you probably learned to work with the Pythagorean Theorem.
This
theorem states that, in a right triangle, with legs measuring a and b and with
hypoteneuse
measuring c, c2 = a2 + b2 .
Given any two of these values, you can solve the equation to find the third.
Example 9: In right triangle ABC, with right angle C, a = 20 and b = 15. Find c.
Example 10: Find the length of the missing side of the right triangle
Example 11: Find the length of the missing side of the right triangle.
The Distance Formula
We can use the Pythagorean Theorem to develop a formula for finding the distance
between any
two points in the coordinate plane.
Suppose you have two ordered pairs,![]() and
and
![]() . We can
find a point C, so that we can
. We can
find a point C, so that we can
draw a right triangle in the coordinate plane. Then we can find the lengths of
the legs of the right
triangle and use the Pythagorean Theorem to find the length of the hypoteneuse.
This will give
us the distance between the two points:
This gives us a formula that we can use to find the
distance between any two points in the
coordinate plane.
Suppose  and
and
 are points in the coordinate plane. Then the
distance between the
are points in the coordinate plane. Then the
distance between the
two points is 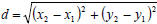 . We call this the Distance
Formula.
. We call this the Distance
Formula.
Example 12: Use the distance formula to find the distance between the points (3, -2) and (-4, -1).
Example 13: Use the distance formula to find the distance
between the points
 and
and
Example 14: Use the distance formula to find the distance
between the points
 and
and  .
.
The Midpoint Formula
Suppose we look at two points in the coordinate plane
![]() and
and
![]() and ask for the
and ask for the
coordinates of the point that is halfway between the two given points. We call
this point the
midpoint.

So the midpoint of a segment with two given endpoints,![]() and
and ![]() is
is
 . This is the Midpoint Formula.
Example 15: Find the midpoint of the segment with endpoints at (-4, 7) and (3,
-1).
Example 16: Find the midpoint of the segment with
endpoints at  and
and

Example 17: Find the midpoint of the segment with
endpoints at (-2.3, 0.7) and (5.8, -2.9).
Example 18: The midpoint of a line segment is (3, -8). One endpoint is (-4, 2).
Find the other
endpoint.